At Spectra Research Corporation, we empower Canadian researchers and industrial sectors with cutting-edge surface science tools—delivering detailed insights into topography, chemistry, mechanics, and more. From Raman and XPS to AFM/NSOM, our instrumentation portfolio enables comprehensive surface and nanoscale analysis critical to today’s material innovation.
-
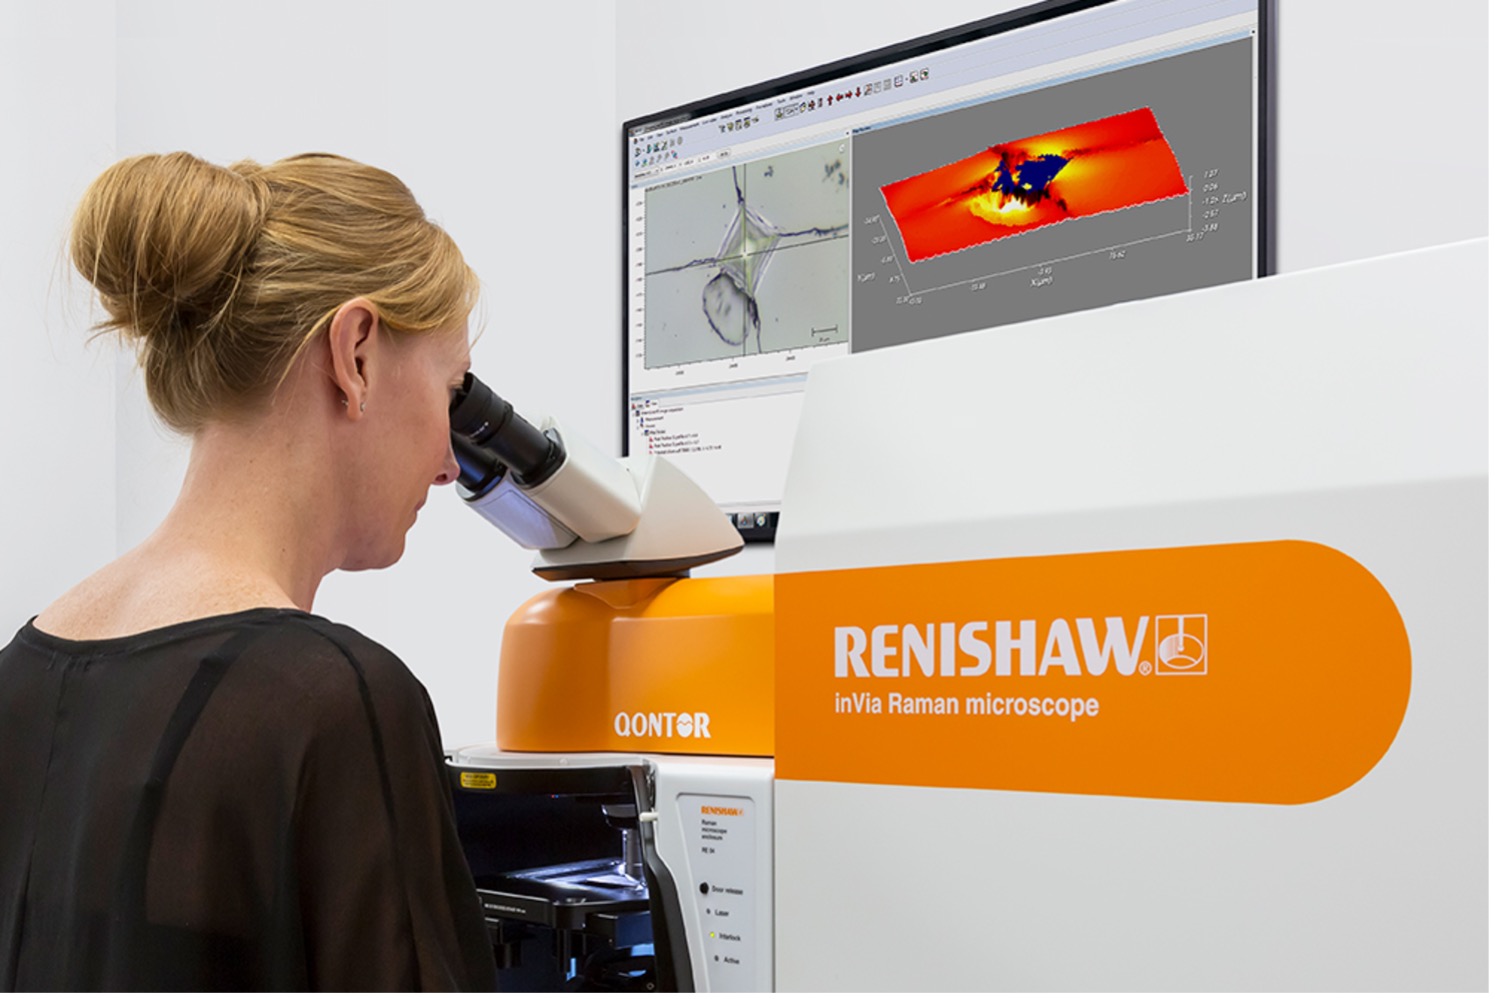
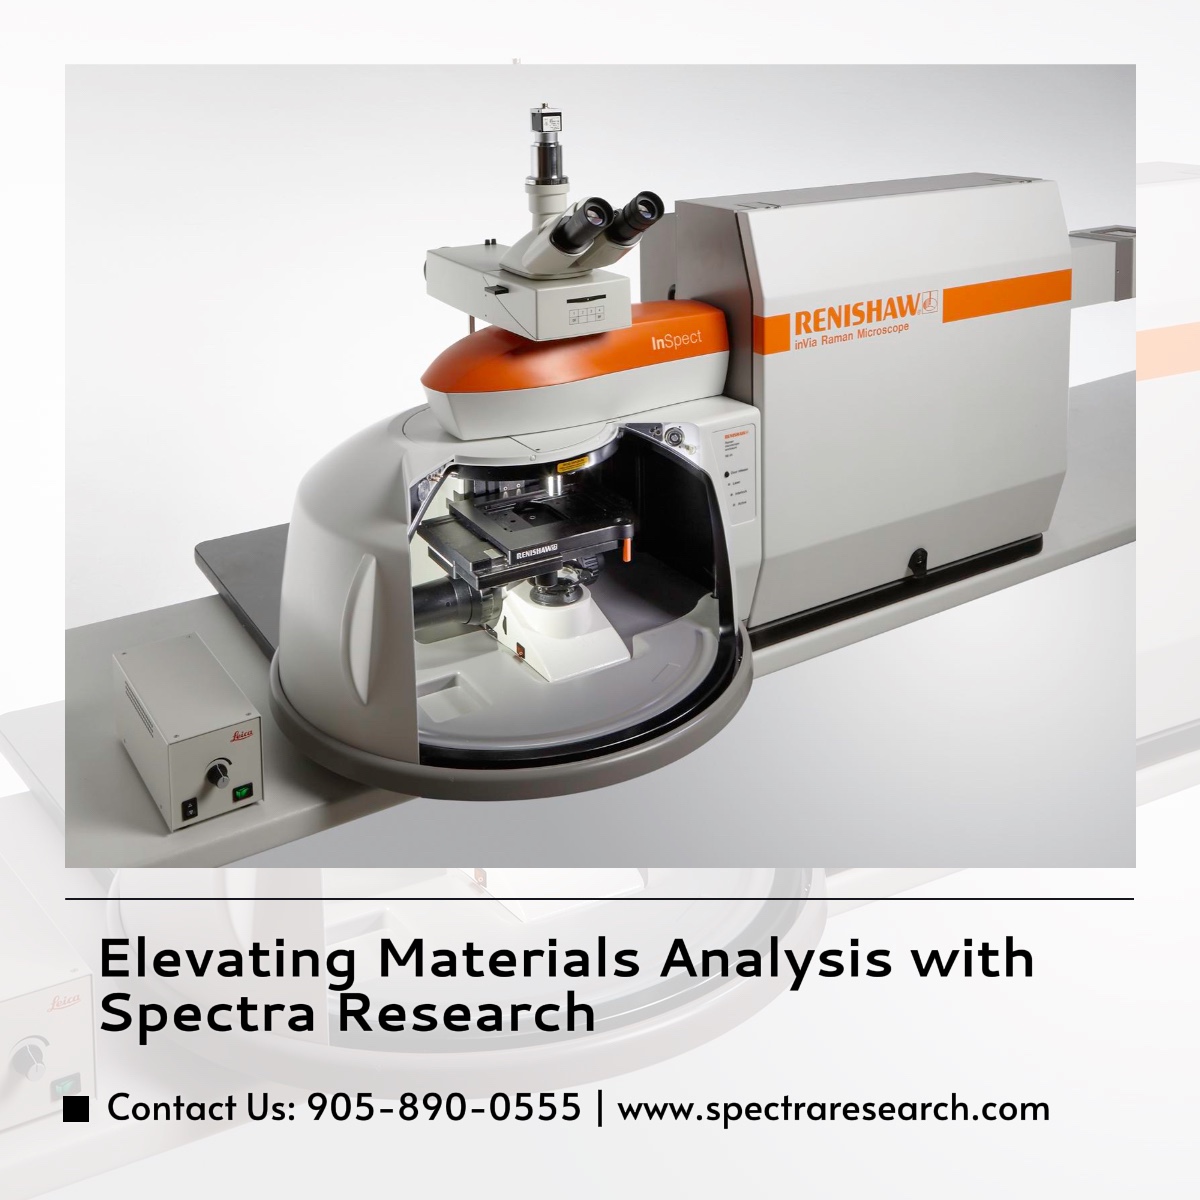
Raman Confocal Microscopy & Correlative Imaging
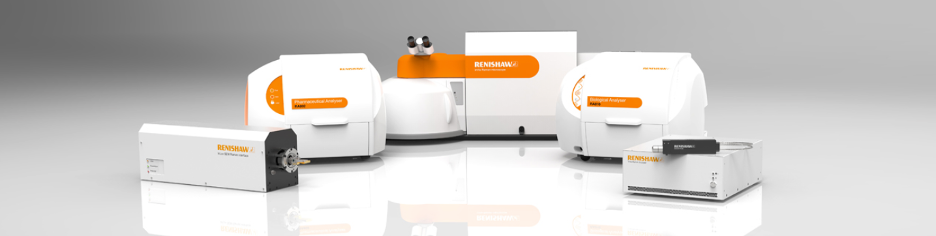
Our Renishaw inVia confocal Raman microscopes are research-grade, offering unparalleled chemical fingerprinting of materials. Unique offerings include:
- inVia-AFM combined systems that integrate atomic force microscopy (AFM) with Raman, enabling simultaneous topographic, chemical, mechanical, and electronic data from the same sample spot—plus the ability to perform nanometer-scale tip-enhanced Raman (TERS).
- inLux SEM-Raman interfaces that bring Raman spectroscopy inside SEM chambers for truly co-located 2D/3D chemical and morphological imaging with sub‑50 nm positional accuracy.
- Additional techniques like fluorescence lifetime imaging (FLIM) combined with Raman add another layer of material characterization.
These systems are ideal for applications in nanomaterials, semiconductors, 2D materials, pharmaceuticals, and life sciences—anywhere chemical structure meets morphology.
-
Atomic Force Microscopy (AFM) & Nano-Mechanical Profiling
Spectra offers AFM solutions spanning:
- High-resolution imaging of metal, polymer, and biological surfaces with sub-nanometer accuracy.
- Advanced modes like conductive AFM (PeakForce TUNA), quantitative nanomechanical mapping (PeakForce QNM), and video-rate imaging—enabling mechanical, electrical, and dynamic surface analysis.
- Combined AFM-IR (AFM coupled with IR spectroscopy) that achieves chemical composition maps at ~10 nm resolution—critical for polymers, biomaterials, and single-molecule studies.
-
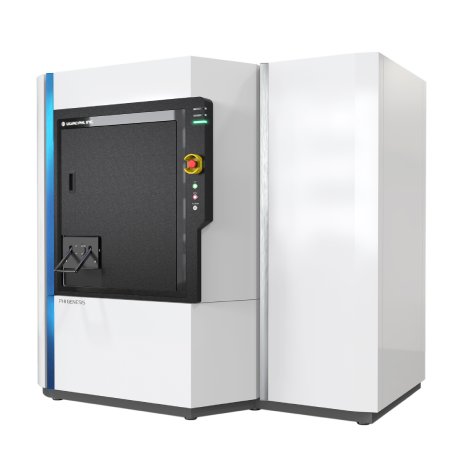
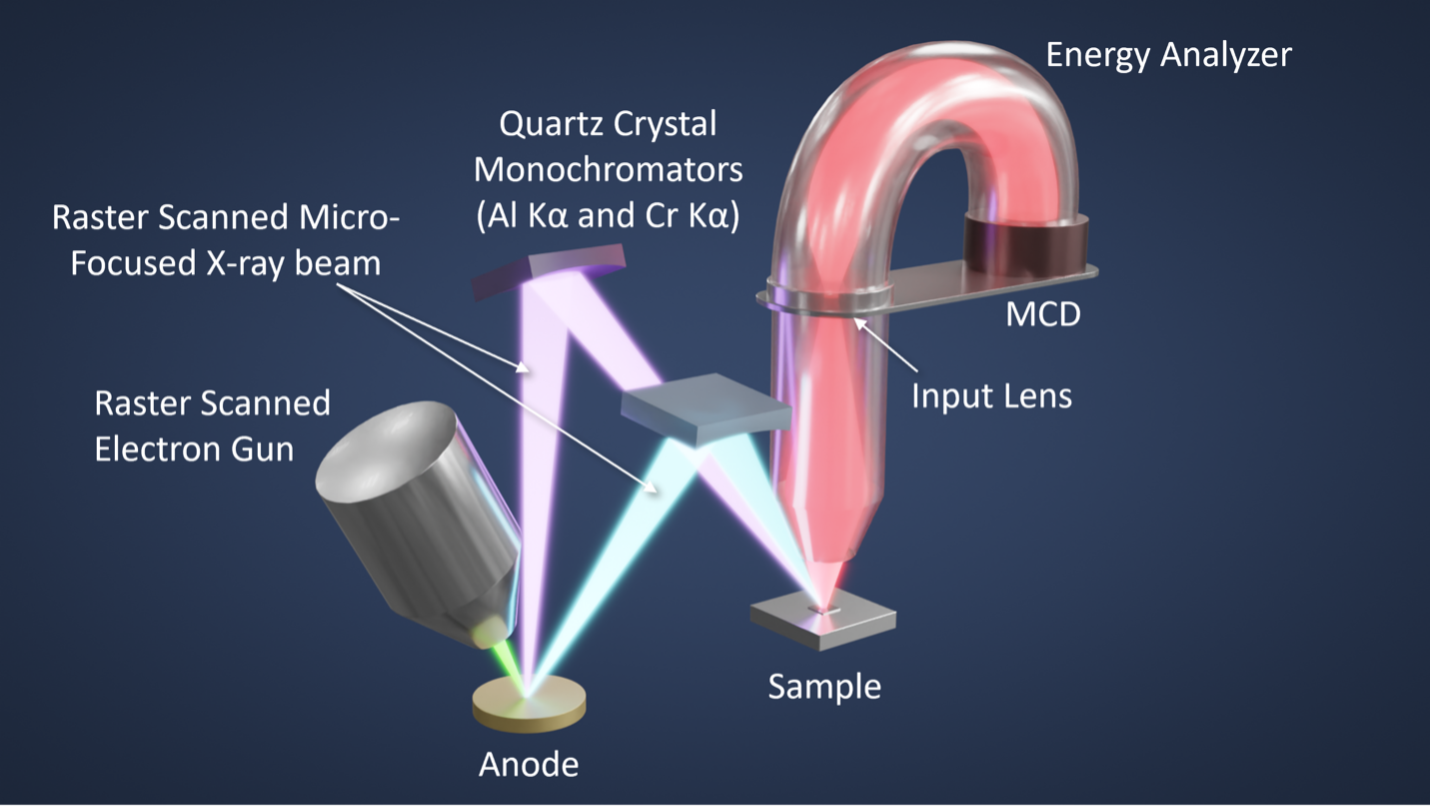
X-ray Photoelectron Spectroscopy (XPS), AES & TOF-SIMS
SRC’s XPS and related systems deliver:
- Surface-depth elemental and chemical state profiling down to nanometer scales.
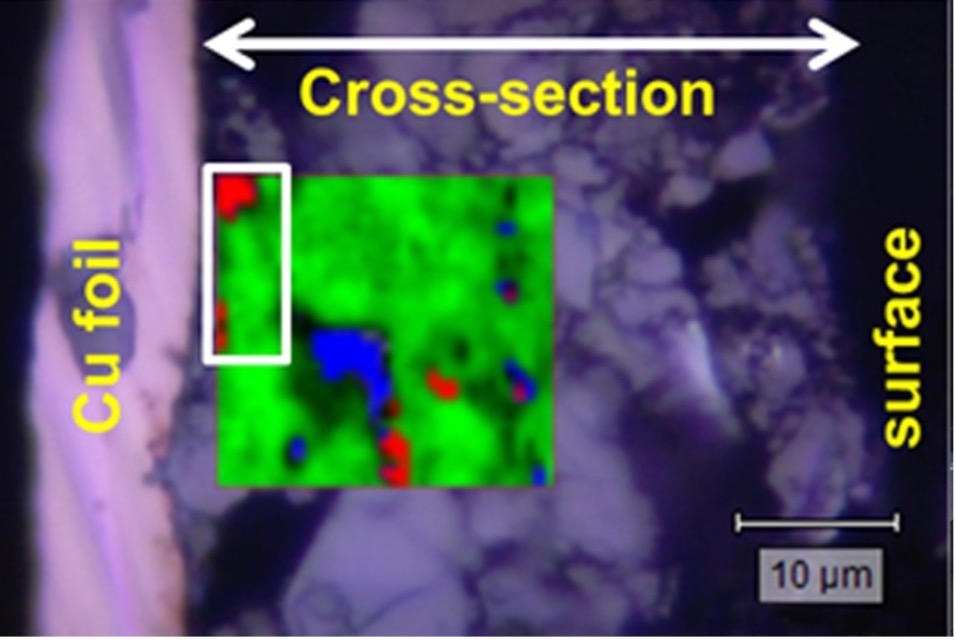
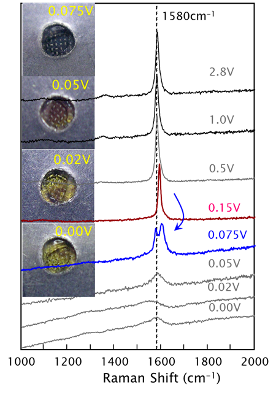
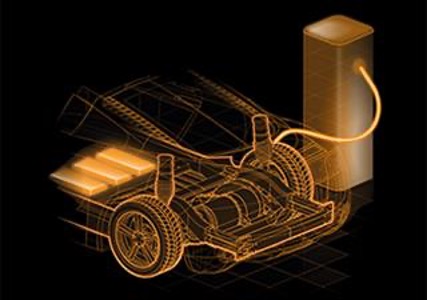
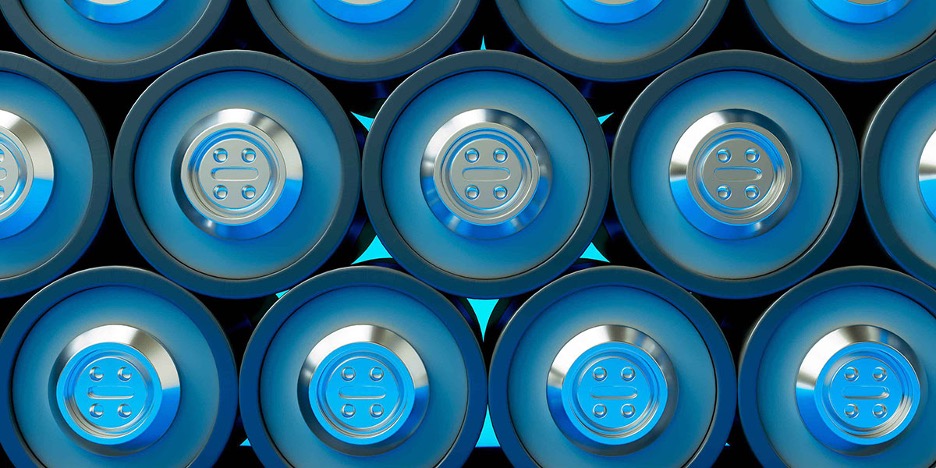
- Applications in battery interface studies, coatings, catalysts, and surface treatments.
- Prime for assessing degradation, passivation layers, and contaminations.
These tools complement our microscopy techniques to paint a complete chemical/topographic picture.
✔️ Why Spectra Research for Surface Science?
| Strength | What We Offer |
| Integrated Correlative Workflows | Raman + AFM + SEM = seamless multi-modal imaging without sample moves |
| Highest Spatial Resolution | TERS, AFM-IR, and FLIM provide chemical insights down to < 10–50 nm |
| Versatile Material Coverage | Ideal for semiconductors, nanotech, materials science, pharma, coatings, and life sciences |
| Expert Support & Training | We help configure systems, train operators, and deliver data interpretation assistance |
Key Applications
- Nanomaterials & 2D Research: Select and characterize individual flakes with Raman/TERS, then quantify mechanical properties via AFM.
- Semiconductor & Thin-Film QA: Detect contaminants, measure film uniformity, assess mechanical integrity.
- Pharma & Bio Interfaces: Use AFM-IR mapping to probe drug-polymer blends, biomolecular assemblies, or lipid films at high resolution.
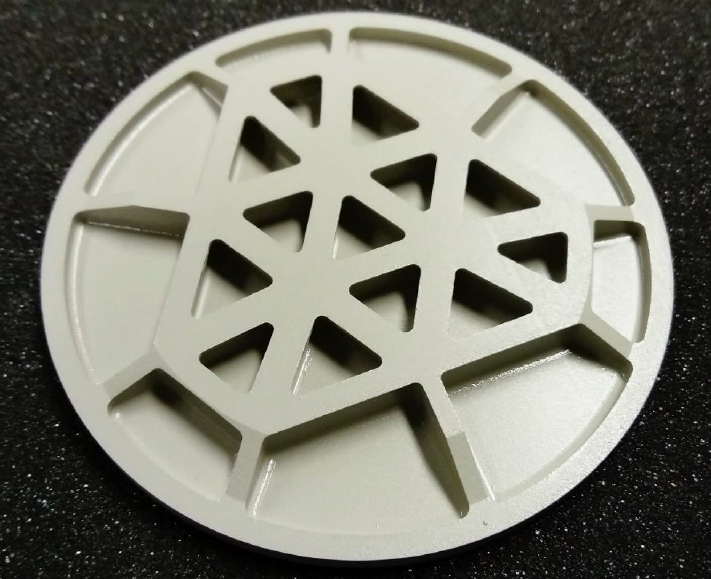
- Coatings & Composite Analysis: Combine surface profiling with compositional mapping to assess coatings, corrosion resistance, or surface treatments.
Partner with Spectra Research
Spectra Research isn’t just a vendor—we’re a solutions partner. From system selection and facility planning to integration, method development, and ongoing support, our teams ensure you harness the full potential of surface science instrumentation.
Unlock the Full Surface Story
When you need more than just images—when chemistry, structure, mechanics, and electronics converge—Spectra Research delivers true multi-modal surface science solutions. Let’s explore how our Raman, AFM, XPS, and IR systems can elevate your research and quality control.
Contact us today to discuss your project and request a demo or consultation.
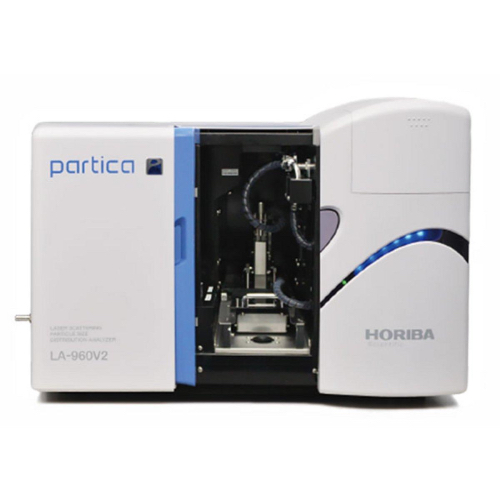

 HORIBA Scientific has 200 years of experience in developing high-performance scientific instruments and analytical solutions. It offers an