THE USE OF ASYLUM TECHNOLOGY

Topological structures in multiferroic materials have recently received considerable attention because of their potential use as nanoscale functional elements. Their reduced size in conjunction with exotic arrangement of the ferroic order parameter and potential order parameter coupling allows for emergent and unexplored phenomena in condensed matter and functional materials systems. This will lead to exciting new fundamental discoveries as well as application concepts that exploit their response to external stimuli such as mechanical strain, electric and magnetic fields. In this review we capture the current development of this rapidly moving field with specific emphasis on key achievements that have cast light on how such topological structures in multiferroic materials systems can be exploited for use in complex oxide nanoelectronics and spintronics.

  1. Introduction

Topological defects play important roles in nature. They are found in fields as diverse as cosmology, [ 1] particle physics, superfluidity, liquid crystals, and metallurgy, manifesting themselves as e.g. screw/edge-dislocations in liquid crystals, [ 2] magnetic flux tubes in superconductors, [ 3] and vortices in superfl uids [ 4] etc. The theory of topological defects, as applicable to condensed matter physics, dates back to the seminal work of Mermin in 1979. [ 5] In a non-uniform ordered medium (i.e., media that can be described by a function f( r ) which assigns an order parameter to every point in that space), topological defects are those regions including points, lines and surfaces where the order parameter ceases to vary continuously, forming regions of lower dimensionality.

At the same time, the possible values that the order parameter can take constitute the order parameter space. For example, the order parameter space for planar spins can be taken as a unit vector that can point in any direction in a plane, i.e., the space is a circle. This allows for mapping of a closed contour of the order …….. Read More from PDFpdf

Webinar: Methods of Viscosity Measurements

 Visco❄holiday: Viscometer GiftRh

► Webinar: Methods of Viscosity Measurements 


VISCO❄HOLIDAY

As a sign of customer appreciation and for the end of 2015, RheoSense presents a viscometer give-away and other prizes for all those completing our end-of-year survey. The following prizes will be awarded:

  • One Grand Prize: A microVISC viscometer* + 50$ Amazon Gift Card
  • Five Second Prizes: 50$ Amazon Gift Cards
  • All participants providing a referral to a friend or college will receive a 10% discount* in all RheoSense products and services

View Ink Application Notes

click

Webinar: Methods of Viscosity Measurements

December 16, 2015 | 11:00 am PST

‘How to measure viscosity?’
In this webinar, we examine how great engineering minds have tackled this question over the years.

We trace the historical development of viscosity and viscometers; starting with the fundamental principles established by Sir Isaac Newton and leading up to modern-day viscometry methods.

Sign up to attend the webinar and get an extra drawing for our promotion! Interested in learning more? Click the button below!

Attend

*Please note, all webinar sign ups will be given an extra entry on our Holiday Viscometer Giveaway!

download

wine vis

Upcoming Conference

Booth

Enter to win ! VISCO HOLIDAY

VISCO ❄ HOLIDAY

visco

As a sign of customer appreciation and for the end of 2015, RheoSense presents a viscometer give-away and other prizes for all those completing our end-of-year survey. The following prizes will be awarded:

One Grand Prize: A microVISC viscometer* + 50$ Amazon Gift Card

  • Five Second Prizes: 50$ Amazon Gift Cards
  • All participants providing a referral to a friend or college will receive a 10% discount* in all RheoSense products and services?

http://www.rheosense.com/events/viscoholiday2015?utm_content=9c21546c5eee2cf80932f71a48fc2f10&utm_campaign=Visco%E2%9D%84Holiday%202015&utm_source=Robly.com&utm_medium=email

New automatic viscometer

Stop_Watch

Automated High Throughput Viscosity Measurements 

High Throughput Automatic Viscometer initium Specifications


Please check out a product preview video here!

Viscometers

We have developed the most advanced viscometers on the market to meet increasing demands for more-accurate, faster, and easier-to use small sample viscometers.

Small-sample viscometer, m-VROC

m-VROC™ Viscometer

The ideal viscometer for demanding R&D applications, m-VROC™ provides flexibility — measuring a wide dynamic range of shear rates with samples as small as 20 microliters. It is the leading viscometer in protein viscosity measurements and many other applications.


High-temperature Viscometer, hts-VROC


hts
-VROC™ Viscometer

The most advanced viscometer for the development of lubricating oils, hts-VROC™ measures oil viscosity from 4 ºC to 125 ºC at shear rates ranging from 100 to 1,000,000 1/s. By providing a complete viscosity curve, it allows you to fully assess your lubricant’s quality.


Portable, small-sample viscometer, microVISC
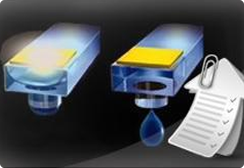
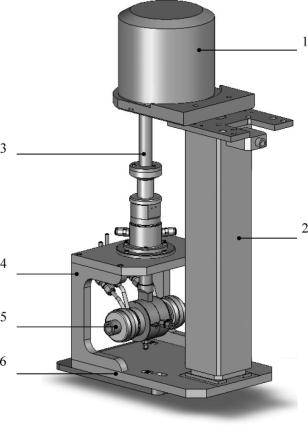
microVISC™ Viscometer
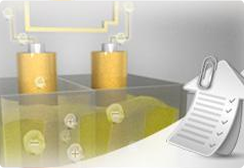
A portable, small footprint viscometer that performs rapid, routine viscosity measurements. microVISC™ is the fastest and easiest-to use viscometer for most applications, and is idea for quality control and small-scale R&D.


Portable, small-sample viscometer, microVISC-m

microVISC- m™ Viscometer


microVISC-m™ viscometer quickly checks the health of your oil. It measures oil viscosity at room temperature and extrapolates estimates of kinematic and dynamic viscosities at 40, 50, and 100 ºC. The device requires a simple one-step operation. Using disposable pipettes, it does not need to be cleaned between tests.

Join the upcoming MRS OnDemand Webinar

Mesoscale Materials, Phenomena and Functionality
Presented by MRS Bulletin
November 18 | 12:00 – 1:30pm ET
Host: John Sarrao, Los Alamos National Laboratory
Attendance for this and all MRS OnDemand Webinars if FREE, but advance registration is required.
REGISTER NOW

The mesoscale domain where atomic granularity, quantization of energy, and simplicity of structure and function give way to continuous matter and energy, complex structures, and composite functionalities, represents a new scientific frontier. The November 2015 issue of MRS Bulletin explores some of the hallmarks of mesoscale materials science and highlights current and new research directions. This webinar will expand on some of the areas of mesoscale science explored in the articles in this issue of MRS Bulletin.

Speakers:
Integration of Computation and Experiment for Discovery and Design of Nanoparticle Self-Assembly
– Sharon Glotzer, University of Michigan
– Nicholas Kotov, University of Michigan

Instrumentation for In-Situ Mechanical Characterization: Nano to Meso
– Douglas Stauffer, Hysitron, Inc.

Bonus Talk:
Understanding and Manipulating Mesoscale Ferroic Domain Patterns
– Long-Qing Chen, The Pennsylvania State University

Technology—Viscometer/Rheometer-on-a-Chip

Viscometer-Rheometer-on-a-Chip (VROC®) combines microfluidic and MEMS (Micro-Electro-Mechanical Systems) technologies.

The Superior Viscometer

Compared to conventional viscometers and rheometers, microfluidic devices offer several advantages. They:

  • Require small sample volumes of liquid
  • Impose high shear rates without encountering flow stability
  • Maintain complete enclosure of fluid to prevent evaporation
  • Can be used as simple flow-through device

More Accurate Viscosity Measurements

Products built on our technology platform completely characterize flow, helping you achieve cost-effective flow and material characterization. Complete viscosity characterization is essential in the production of complex liquids with non-Newtonian viscosity characteristics.

Our technology quantifies true flow properties, whereas many existing products only qualitatively approximate apparent properties.

Why MEMS and Microfluidics for Viscosity?

Microfluidics deals with the behavior, precise control, and manipulation of small (microliter and nanoliter) volumes of liquids. Microfluidics enables high throughput analysis.

MEMS chips integrate mechanical elements, sensors, actuators, and electronics on a common silicon substrate, using microfabrication technology.

Through its hybrid microfluidics/MEMS technology, RheoSense has developed smaller, smarter, and faster micro-scale-sample viscometers, which can measure fluids’ viscosity in all types of environments.

Principle of RheoSense Viscometers

VROC® sensors read viscosity by measuring the pressure drop as a test liquid flows through its flow channel. This is a well-known application of rheometry principles (K. Walters, Rheometry, Chapman and Hall, London, 1975) and also listed in US Pharmacopeia.

Slit Viscometer/Rheometer

As the test liquid is forced to flow through the sensor’s flow channel, the rheometer measures pressure at positions increasingly far from the inlet.

In this resulting (example) plot of measured pressure versus sensor position, the slope of the straight line is proportional to the viscosity.

Slope of pressure/position graph indicates viscosity

Our Viscometer Implementation

To create a dynamic micro-sample viscometer, RheoSense took this principle and added microfludics, while reducing the device’s size. Our resulting VROC® technology offers capabilities well beyond the limits of conventional viscometers.
quote-symbol-lt-tp

VROC® is capable of making measurements not possible with other instruments…the ability of the RheoSense viscometer to measure very small sample quantities is also useful. We have found the instrument to be accurate and reliable
quote-symbol-tt-btm

— A corporate R&D Customer

apyron∞ – Class-leading Performance: Automatically

With the apyron imaging system you will be prepared to explore beyond the established frontiers of your field. It has been developed to overcome the boundary between ease-of-use and ultimate capability in Raman Imaging. Equipped with this seamless versatility, your creativity can be fully expressed.


When simplicity meets performance

As a member of the WITec product family, apyron sets the benchmark for automated Raman Imaging systems with excellent imaging qualities: outstanding spectral and spatial resolution, ultra-fast acquisition times, and exceptional signal sensitivity in combination with automated system configurations and intuitive measurement procedures.


When high-resolution imaging meets high-resolution spectroscopy

Ultrahigh-throughput spectrometers provide unprecedented spectral resolution, detailed spectral information at every image pixel and the highest Raman signal sensitivity.


apyron is the ideal Raman imaging system for:

  • Multi-user labs accomodating varied user skills and requirements
  • Industry labs with recurring experimental scenarios and an emphasis on time-critical turnover
  • Raman newcomers with advanced imaging requirements
  • Leading Raman spectroscopists seeking the next performance benchmark

The new automated Raman Imaging system apyron

A New Class of Automated Raman Imaging Systems – Key Features

WITec is established as the manufacturer of the industry‘s most advanced Raman Imaging systems. This distinction now also extends to automated  systems.

TruePower: Automated Absolute Laser Power Determination in mW

The absolute laser power is measured in the optical fiber and can be adjusted with accuracy of <0.1 mW. A laser shutter shields the sample from the laser light and opens only during Raman analysis with optimized laser power to avoid any sample degradation. apyron is the only Raman Imaging system on the market to provide such an accuracy ensuring optimal laser power for the preservation of delicate samples and reproducibility in measurement conditions.


Automated Laser Wavelength Selection and Spectrometer Adjustment

The selection of the laser has never been easier: With a simple click of the mouse the wavelength can be chosen in the software user interface. What follows is an automated adjustment and calibration of all spectrometer components such as filters, gratings etc. to enable optimal system performance.


Performance Facts:

  • More than 16 million Raman spectra can be acquired in a single dataset
  • Spectral resolution down to 0.1 rel. 1/cm per pixel (@633 nm excitation)
  • 3D Raman Imaging at a lateral resolution limited only by physical law
  • Push-button instrument and measurement control

Ultrahigh-throughput Spectrometers for Unprecedented Spectral Resolution, Detailed Spectral Information at Every Image Pixel and the Highest Raman Signal Sensitivity

The lens-based imaging spectrometer was specifically designed for Raman microscopy and applications at ultra-low light intensities. Versions are available for a wide variety of excitation wavelengths and focal lengths and are optimized for their specific laser wavelength:

  • UHTS 300 for most effective and ultrafast 3D confocal Raman Imaging
  • UHTS 400 for excellent spectral and image quality for the red and NIR
  • UHTS 600 for unrivaled spectral resolution in 3D confocal Raman Imaging


Additional Features:

  • Automated sample positioning and motorized scan tables
  • Software-controlled measurement settings
  • TrueSignal: system-controlled adjustment of the optical fiber position to maximize the light into the fiber output of the microscope
  • TrueCal: convenient performance of pre-defined calibration routines for the optical and mechanical microscope components whenever required
  • Laser safety class 1

apyron: powerful data acquisition and post-processing

apyron Applications

Carbon Tetrachloride in an Alkane-Water-Oil Emulsion

Carbon Tetrachloride is quite often used as a reference sample in order to determine the performance of a Raman spectrometer in terms of spectral resolution. The characteristic peak at 460 rel. 1/cm should be clearly resolvable at room temperature. Due to its ultra-high optical throughput the apyron is the first system on the market to allow for FAST RAMAN IMAGINGTM while simultaneously maintaining the ability to resolve this peak.

apyronAppl01

3D confocal Raman image of the emulsion. Green: Alkane; Blue: Water; Yellow: CCl4 + Oil. (Image parameters: 200 x 200 x 20 pixels, 100 x 100 x 10 µm³ scan range, 0.06 s integration time per spectrum, 532 nm excitation wavelength.) Zoom-in image with high spectral resolution. (Image parameters: 100 x 100 pixels, 10 x 10 µm², 0.08 s integration time per spectrum, UHTS 600 spectrometer, 1800 g/mm grating.) Due to the high spectral resolution of the spectroscopic system the bands of the CCl4 peak at 460 cm-1 can be clearly resolved at room temperature.

White-light microscopy and color-coded Raman Image overlay of a squashed banana pulp sample

The Raman image was acquired with an apyron attached to the 600 mm focal length UHTS 600 spectrometer system (grating: 300 g/mm) to provide the highest spectral performance. Red: beta-Carotene-rich areas, Green: Starch, Blue: Water

apyronAppl02

Only the apyron is capable of generating Raman images along with the parameters as in the following: Excitation: 532 nm, Laser Power: 49.9 mW, Scan area: 400 x 300 µm², 1200 x 900 pixels, Integration time: 2 ms/spectrum/pixel

Adaptation of standard thermal analyzers and calorimeters

It may occur that standard instruments are limited in terms of application because of temperature, pressure ranges available, because of the lack of chemical compatibility of some materials against the atmospheres to be tested, or because they cannot achieve very specific functions.
Coupling analytical methods can be a way to draw more information from a single sample to understand more into depth its chemical / physical behavior, or to obtain simultaneous data under the exact same conditions. But it requires the evolution of standard analyzers so that they can physically fit and that they are not disturbed by their simultaneous operation.
For such reasons the SETARAM standard thermal analyzers can be customized

…for specific sample and process conditions

SETSYS Evolution schematics

Thermogravimetry is a common technique for the characterization of the thermal stability of materials, to understand their degradation process or to analyze their composition. Some materials like fluorides or oxyfluorides – which have interesting optical properties – release significant amounts of corrosive gases during their thermal stability testing. To fit to a customer request, our standard SETSYS Evolution TGA was modified in order to stand the release of fluorine and hydrofluoric acid (up to 20% of initial sample mass). A further challenge was that the users wanted to test the material mass uptake under a flow of a gas containing up to 10% in mass of fluorine.

For more information on the SETARAM achievements in that field, click here and download technical note TN701 in our application library

…for multiple simultaneous measurements

 Schematics of the setup after microbalance integration,
reproduced from P. Bazin and al, Dalton Trans., 2010, 39, 8432–8436

A good way to determine the adsorbed species on the surface of a catalyst is infrared spectroscopy, while thermogravimetry is a good tool for the quantification of those adsorbed species. The Laboratory of Catalysis and Spectrochemistry of Caen (France) approached us to modify a standard microbalance in order to fit it with operando IR spectroscopy. The goal was to develop a TG-IR coupling with an IR beam directly oriented to the surface of the catalyst being weighed by the balance.