
Description
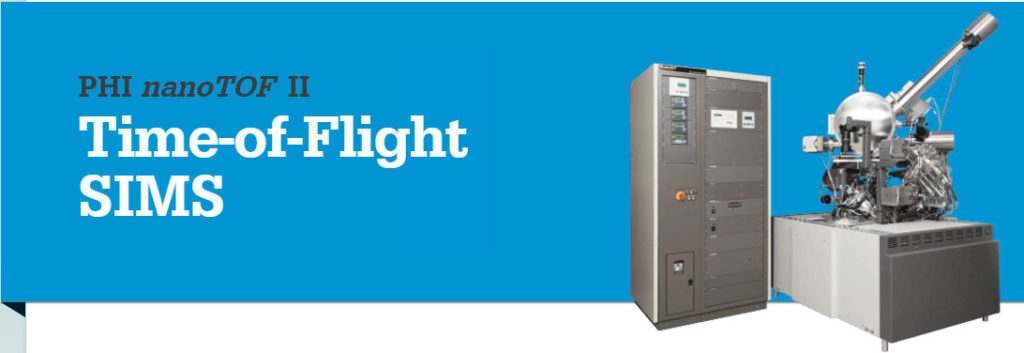 |
| PHI’s patented TRIFT mass spectrometer provides superior sensitivity, low spectral background, and the unique ability to image highly topographic surfaces. The nanoTOF II can be configured with a wide variety of options to optimize performance for organic materials, inorganic materials, or both, depending on customer requirements. The newest option for the nanoTOF II, Parallel Imaging MS/MS, allows secondary ions of choice to be extracted from the TOF-SIMS data stream for fragmentation and analysis in a separate TOF analyzer. This provides for unambiguous peak identification and paralleltandem MS imaging capability. |
|
Superior TRIFT Analyzer Performance
|
HR²High spatial resolution with high mass resolution
|
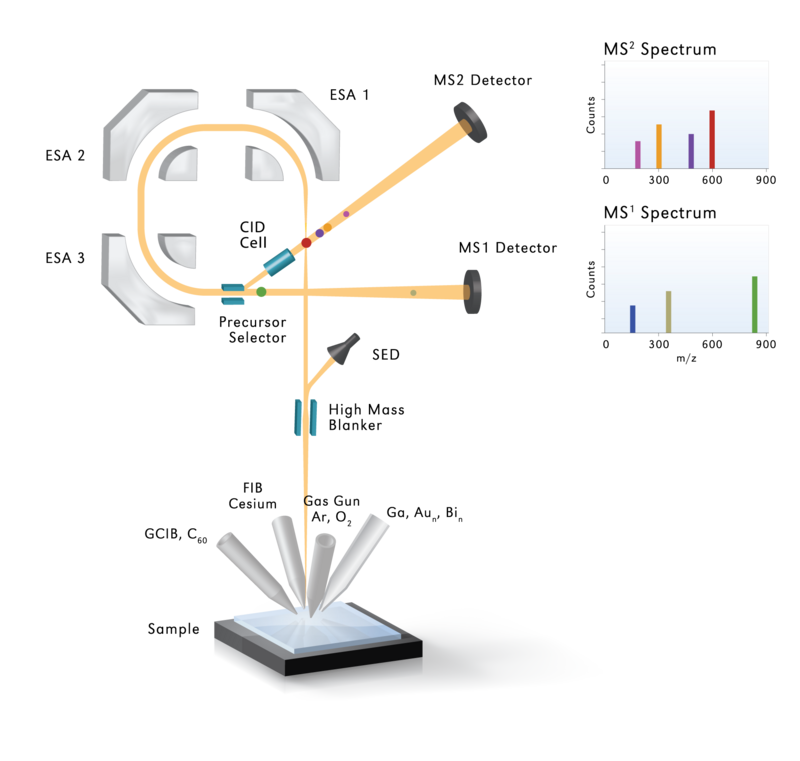
Parallel Imaging MS/MS – NEW!Due to the limitations of TOF-SIMS in mass accuracy and mass resolution, high mass peaks often go unidentified in traditional TOF-SIMS experiments. PHI’s new revolutionary Parallel Imaging MS/MS option eliminates this limitation. In the MS/MS mode, a precursor ion of choice (1 Dalton wide nanoisotopic acceptance window) is selected from the secondary ion stream and deflected into a high energy collision induced dissociation (CID) cell while the rest of the secondary ions are collected as usual (MS1 data). In the CID cell, the precursor ions collide with argon gas causing fragmentation. The resulting fragment ions are mass separated in a linear TOF and counted at a second pulse counting detector, producing an MS/MS spectrum (MS2). Similar to the MS1 data, a full spectrum is collected for each image pixel in the MS/MS experiment. Thus, the MS/MS tand traditional TOF-SIMS data are collected simultaneously from the same analytical area in a single experiment. The imaging speed of both MS1 and MS2 data is based on a pulsed ion beam operated at >8 kHz. The resulting MS/MS fragmentation spectrum is used to positively identify the composition of the precursor ion by identification of the fragmented ions and/or comparison to mass spectral databases. Operating the TOF-SIMS in the MS/MS mode can also improve the sensitivity for species in which the peak of interest has mass interferences with other compounds. By detection of a unique fragment ion originating from the species of interest, the limit of detection can be greatly improved.
|
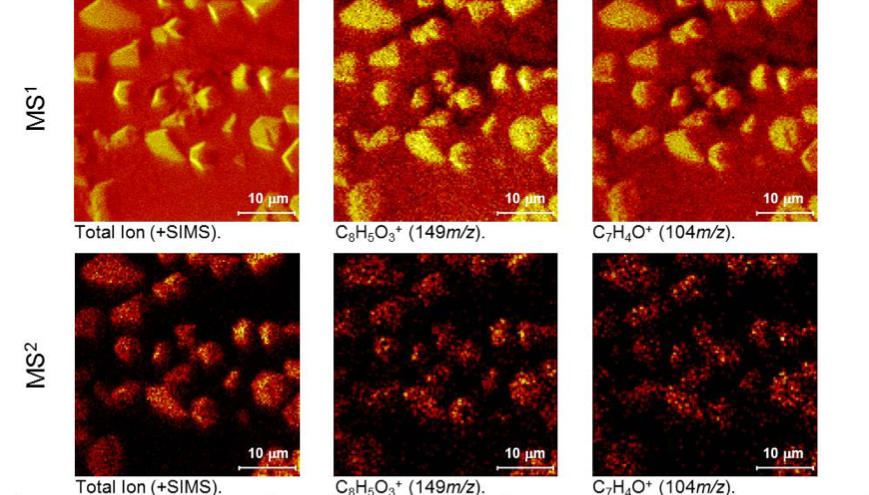
| Parallel imaging of MS1 and MS2 peaks from a sample of heat treated PET, showing that identical areas are analyzed at the two detectors and that the precursor molecule at +m/z 577 (ethylene terephthalate trimer) is localized to the crystals. Line scans show <200 nm spatial resolution for both modes of imaging. MS1 and MS2 data are collected in parallel at 8 kHz in less than 15 minutes.
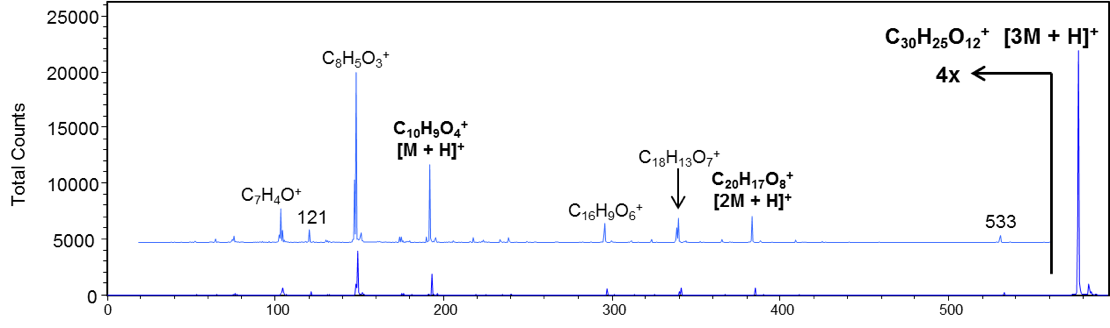
Heat treated PET sample. Composition assignments for the MS2 spec. trum obtained from CID fragmentation of the +mass 577 precursor ion confirm that the observed crystals are composed of ethylene terephthalate trimer
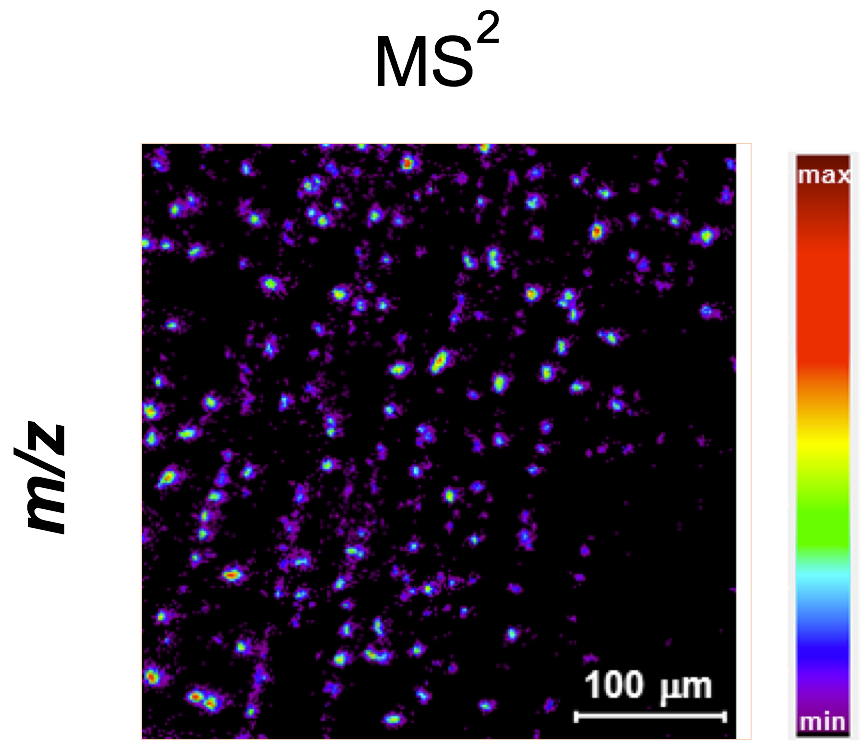
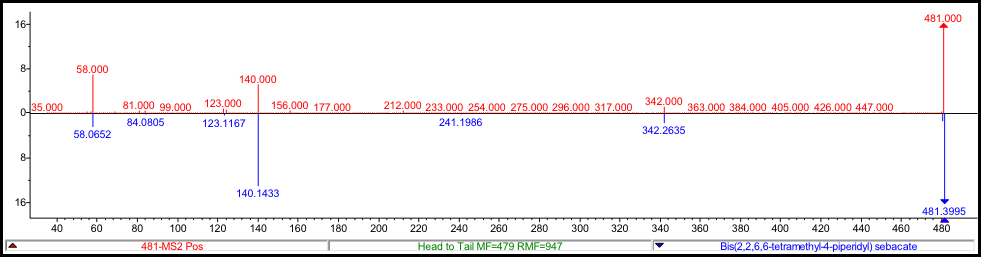
Automotive polymer sample. MS/MS image (MS2) of the +m/z 481 precursor ion showing a non-uniform distribution of the species on the sample surface.
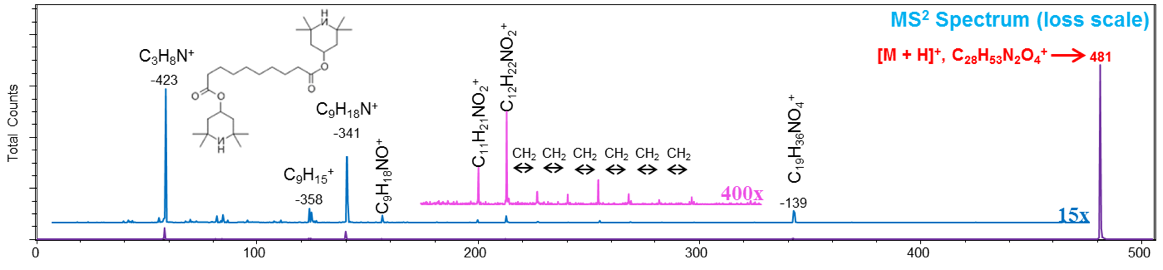
MS/MS spectrum (MS2) obtained from CID fragmentation of the +m/z 481 precursor ion. Identification of the fragment ions indicates that the precursor ion [M+H]+ is Tinuvin 770, a polymer additive.
Further confirmation of the identity of the precursor ion is made with a positive match to Tinuvin 770 in a commercially available MS/MS database which is included with the MS/MS option. The spectrum in red is the MS2 spectrum and the blue spectrum is the acquired reference database spectrum of Tinuvin. |
Cluster Source Ion GunsMultiple cluster source ion gun options
|
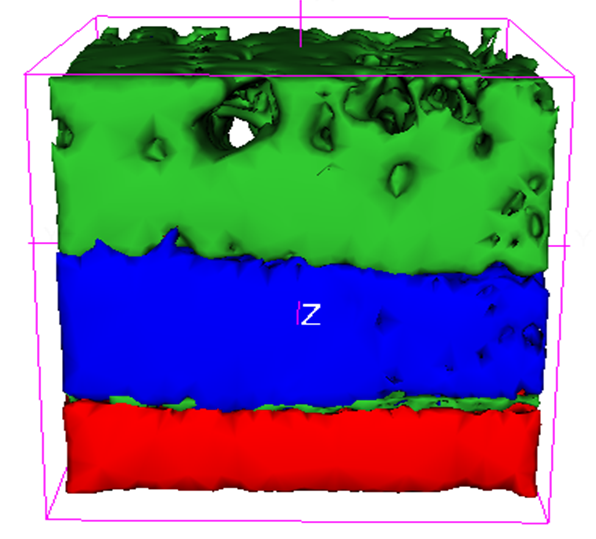
FIB-TOF 3D Chemical Imaging
|
Features & Accessories
|